Just a few weeks ago we published a paper on Genome Urbanization, a concept describing the spatial clustering of genes in the unicellular eukaryote genome of S. cerevisiae (you can read more about it here). One of the things we put forward in that paper was the existence of discrete topological domains in the yeast genome that strongly resembled the Topologically-Associated Domains (TADs) initially discovered in mammals and now found in most complex eukaryotes. We based our arguments on some rather clear topological boundaries that we were able to observe on HiC contact maps obtained from a widely cited (Duan et al, 2010) public dataset. As you may see in the bottom of the Figure below (adapted from Figure 4D of our paper), one can locate boundaries between TAD-like domains even by eye inspection. In order to do so, we used an insulating approach (as described by Crane et al, Nature 2015) that is largely independent of the local read density. After defining such insulating regions we went on to show that genes that are up-regulated upon topological stress tend to cluster within these regions.
But since TADs had not (at the time) been reported in yeast, one of the main criticisms that we received during the review process was directed at this analysis. The reviewer's comment was:
"Authors declare the existence of TAD-like globules in budding yeast. However, these kinds of structures have, so far, never been detected in Saccharomyces cerevisiae. If the authors want to establish the existence of such TAD like structures, they must reinforce their analysis."
At the time, we were eager to get the paper accepted and so we down-played the original term "TAD-like" in "insulated domains" in the final version. Figure 4D remained though and was further supported by a number of analyses that showed the robustness of the boundaries upon different normalization strategies and the lack of LTRs in these regions. In our view, it mattered little to get the message of "TADs also exist in yeast" across, as our main interest was to show the tendency for spatial clustering of genes.
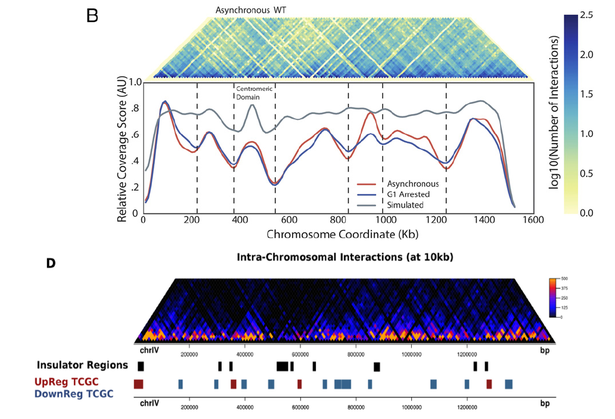
HiC contact maps for yeast chromosome IV. Top: Figure 1B from Eser et al. (PNAS, 2017). Bottom: Figure 4D from our Genome Urbanization paper (Tsochatzidou et al, Nucleic Acids Res, 2017). Even though the original HiC datasets are not the same (top: Noble lab 2017, bottom: Noble lab 2010) the maps show great similarity. The location of the boundaries shows significant discrepancies as the way to define them differs (see text below).
We were nevertheless right all along as was only recently shown in a paper by the Noble lab (whose original data we had used in our analysis). In a paper that just came out in PNAS, Eser et al., show that TADs do exist in yeast and that they have some very interesting properties. Eser et al., use a new HiC dataset (it seems that you cannot escape the curse of having to RE-do the experiments even if you were the one to perform them originally) but apply a different method to call the boundaries. Their "coverage score" is interesting as an approach because it is insensitive to the resolution of the obtained boundaries (a problem we had to deal with by arbitrarily choosing a 10kb window) and leads to fewer TADs that we were able to define but this is likely related to thresholds in the calling process (we used a 5%-percentile approach, while Eser et al use a local minimum function). Eser et al, find 41 TADs, (we found 85) with a median size that is more than double of the one we found (260kb vs our 100kb). The fact that remains is that there is significant coincidence between both the maps and the boundaries as you can see in the Figure above (adapted from Figures 1B from Eser et al, 2017 and 4B from our paper).
What is more important, the properties that are shared by the TAD boundaries in Eser et al. are matching our observations in many respects, as they are shown to be enriched in transcription activity (as originally shown by the group of Sergei Razin) and activating histone marks. Above all, Eser et al. report that regions between the defined TADs are significantly overlapping areas of topoII depletion, which constitutes an immediate link to our finding that genes that tend to be up-regulated by topoII inactivation are enriched in insulated regions (remember this was our way to call TAD boundaries, without using the term "TAD"). Thus, even though one of the main arguments in Eser et al. is that TADs in yeast are mostly related to DNA replication than transcription, it seems that you cannot really do away with transcriptional effects in relation to chromatin organization, especially in a unicellular eukaryote genome where the two processes are expected to be more tightly connected.
In closing, we can now be confident that TADs, or TAD-like domains if you will, do exist in yeast and that they are inherently related to both DNA replication and transcription (even though perhaps indirectly). Our observations under topological stress lie in the interphase between the two processes as torsional stress accumulation inevitably affects the DNA replication process. Even more interesting, in our view, is the fact that the embedded constraints in the organization of genome architecture are reflected on the evolution of gene distribution along chromosomes, but then again we have already discussed this elsewhere. One last point that we can make is that it is reassuring to see you can constructively argue with a reviewer (provided the reviewer's sanity) if your hypothesis is solid and supported by the data and that it is always nice to see you were right in the first place, even though sometimes courtesy towards a reviewer obliges you to be less audacious in the choice of terminology.
 RSS Feed
